
|
EIDORS: Electrical Impedance Tomography and Diffuse Optical Tomography Reconstruction Software |
|
EIDORS
(mirror) Main Documentation Tutorials − Image Reconst − Data Structures − Applications − FEM Modelling − GREIT − Old tutorials − Workshop Download Contrib Data GREIT Browse Docs Browse SVN News Mailing list (archive) FAQ Developer
|
Splitting and joining modelsThis tutorial shows how a model can be split and joined using the crop_model and join_model functions.Cropping models (2D)
imdl = mk_common_model('a2c0',8); fmdl= imdl.fwd_model;
subplot(131); show_fem(fmdl ,[0,1,1]); xlim([-1,1]);

fmdl1= crop_model(fmdl,inline('x<-0.4','x','y','z'));
fmdl.nodes(:,1) = fmdl.nodes(:,1) + 0.25;
subplot(132); show_fem(fmdl1,[0,1,1]); xlim([-1,1]);

% reverse
fmdl2 = fmdl1; fmdl2.nodes(:,1) = -fmdl2.nodes(:,1);
fmdl2 = crop_model(fmdl2,inline('x+y<-1.28','x','y','z'));
fmdl2 = crop_model(fmdl2,inline('y<-0.95','x','y','z'));
fmdl2 = crop_model(fmdl2,inline('x<-0.95','x','y','z'));
subplot(133); show_fem(fmdl2,[0,1,1]); xlim([-1,1]);

print_convert('split_join01a.png',struct('pagesize',[12,5]));
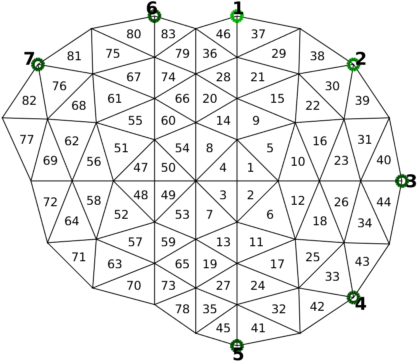
 Figure:
Left: original model
Centre: cropped and
Right: cropped and flipped sections of the model Figure:
Left: original model
Centre: cropped and
Right: cropped and flipped sections of the model
Models to join (2D)
idx  = fmdl1.nodes(:,1)<-0.25;
fmdl1.nodes(idx,1) = -0.25;
fmdl1.nodes(:,1) = fmdl1.nodes(:,1) + 0.25;
subplot(131); show_fem(fmdl1,[0,1,1]); xlim([-1.3,1.3]); axis off

idx  = fmdl2.nodes(:,1)>+0.25;
fmdl2.nodes(idx,1) = +0.25;
fmdl2.nodes(:,1) = fmdl2.nodes(:,1) - 0.25;
subplot(132); show_fem(fmdl2,[0,1,1]); xlim([-1.3,1.3]); axis off

subplot(133); show_fem(fmdl1,[0,1,1]); xlim([-1.3,1.3]);
hold on; hh=show_fem(fmdl2,[0,1,1]); set(hh,'EdgeColor',[0,0,1]);
hold off; axis off

print_convert('split_join02a.png',struct('pagesize',[12,6]));
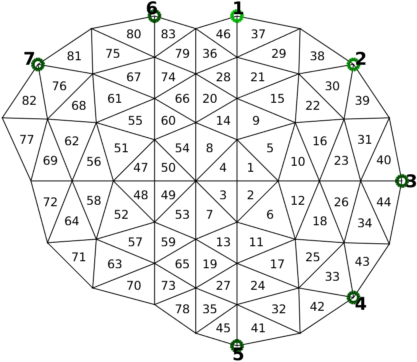
 Figure:
Left: left model
Centre: right model
Right: models to join Figure:
Left: left model
Centre: right model
Right: models to join
Join the models
fmdlu= join_models(fmdl1, fmdl2);

clf; subplot(131); show_fem(fmdlu, [0,1,1]); axis off;

print_convert('split_join03a.png',struct('pagesize',[15,5]));
 Figure:
Joined model. Note that electrodes and elements have been renumbered Figure:
Joined model. Note that electrodes and elements have been renumbered
Cropping models (3D)
   imdl = mk_common_model('n3r2',[16,2]); fmdl= imdl.fwd_model;
   fmdl1= crop_model(fmdl,inline('x<-0.55','x','y','z'));
   idx  = fmdl1.nodes(:,1)<-0.25;
   fmdl1.nodes(idx,1) = -0.35;
   fmdl1.electrode([19,9])=[];
   fmdl1.nodes(:,1) = fmdl1.nodes(:,1) + 0.35;


   fmdl2 = fmdl1;
   fmdl2.nodes(:,1) = -fmdl2.nodes(:,1);

subplot(121); show_fem(fmdl1); axis off; view(0,65); xlim([-1.3,1.3]);
subplot(122); show_fem(fmdl1); axis off; view(0,65); xlim([-1.3,1.3]);
hold on; hh=show_fem(fmdl2,[0,1,0]); set(hh,'EdgeColor',[0,0,1]);
hold off;

print_convert('split_join04a.png',struct('pagesize',[12,5]));
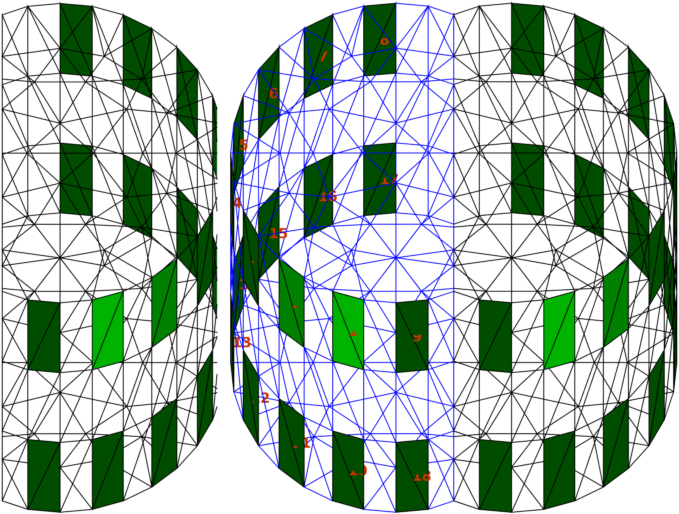
 Figure:
Left: cropped model
Right: models to join Figure:
Left: cropped model
Right: models to join
Join the models
fmdlu= join_models(fmdl1, fmdl2);
clf; subplot(121); show_fem(fmdlu); axis off; view(0,65); xlim([-1.3,1.3]);

print_convert('split_join05a.png',struct('pagesize',[12,5]));
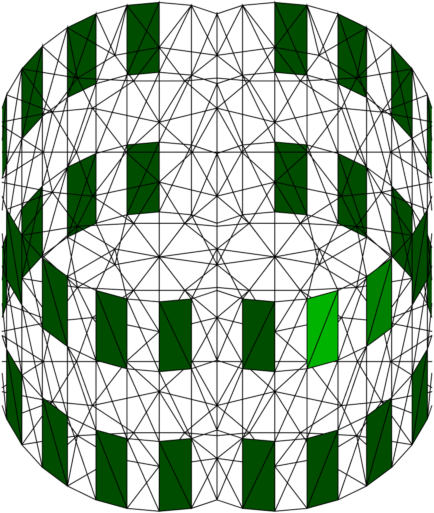
 Figure:
Joined model. Figure:
Joined model.
|
Last Modified: $Date: 2018-05-20 11:12:29 -0400 (Sun, 20 May 2018) $ by $Author: aadler $